UPDATE: Join Carly Born for her Dashboard Poster Presentation at ELI this January
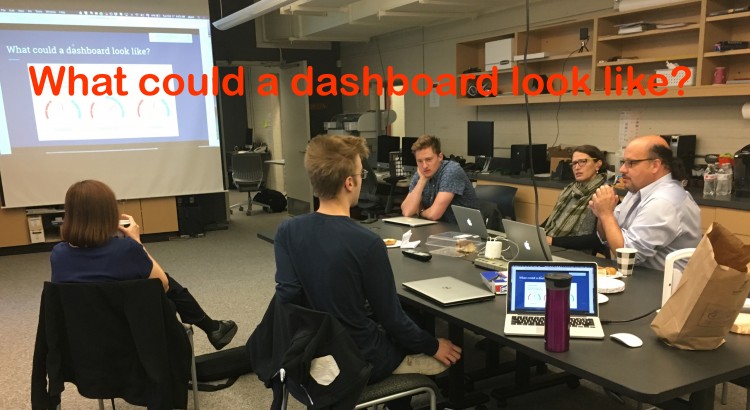
As a sequel to last summer’s Hack-a-thon Toward a Collaborative Language Diagnostics and Refresher Framework at Swarthmore College, a dedicated group of language learning technologists and Carleton’s student “Data Squad” gathered this fall at Carleton College to work on platform requirements for a dashboard prototype. Led by Michael Jones and Carly Born, this two-day mini-hack-a-thon focused on solving technical pieces of the puzzle that will enable the flow of useful data from a language skills diagnostic test into a data-rich visual display.
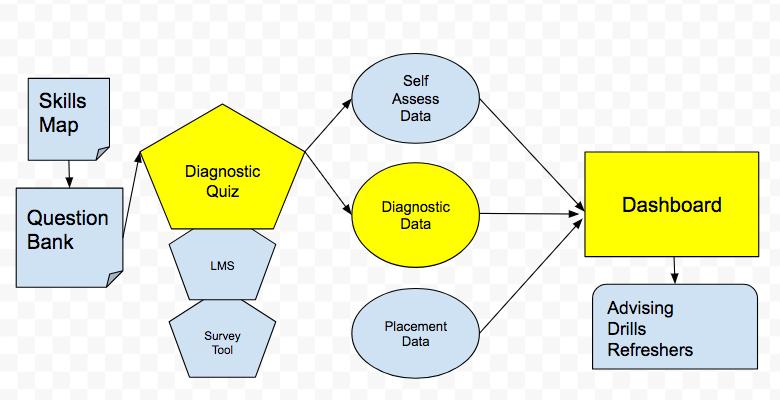
The dashboard is just one piece our faculty’s vision for the shared framework drafted at the meeting last May. Elements include a language skill map, a self-assessment survey, diagnostic/placement tests (question banks) and the dashboard that can help faculty visualize the data for better placement and advising.
Language Learning Skills Map / Top Level Categories:
- Grammar
- Comprehension
- Discourse
- Vocabulary
Diagnostic visualizations also may point to trends in language skills development within and across our liberal arts programs and language curricula. A user-friendly dashboard tool can ultimately help students gain feedback on their skill levels and close gaps as they traverse the liberal arts language sequence.
Event: Language Skills Diagnostic Dashboard Prototyping
Location: On the campus of Carleton College
Dates: October 16-17
Leads:
- Michael Jones, Director, Language and Media Center, Swarthmore College
- Carly Born, Academic Technologist, Carleton College
Related Resources: